Problem Solving using Cardiac CT by Modifying Technique
Dr Ashley Thorpe, Dr Rajiv Singh and Dr Garrett McGann
An 80 year old presented to the emergency department after suffering syncope whilst sat in a chair with no prodromal features. Past medical history included COPD, bronchiectasis and hypothyroidism.
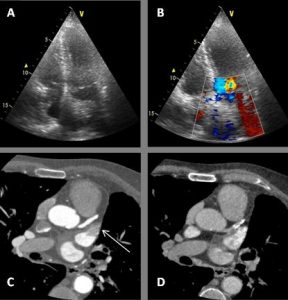
As a result, a transthoracic echocardiogram (TTE) was arranged as an outpatient which demonstrated a mildly dilated left atrium at 60mls and an echogenic structure visualised within the left atrium with a possible attachment to the atrial septum. Colour flow is seen to contour the structure. (Figure 1A &B)
Question 1: What is the most common cardiac tumor?
- Lipoma
- Myxoma
- Metastases
- Sarcoma
Answer:
C) Metastases – Metastases are estimated to be 30 times more common than primary cardiac tumors. Common tumors which frequently metastasize to the heart include breast, melanoma and lymphoma. (1)
A CT cardiac angiogram was arranged to further investigate the ultrasound abnormality. A transoesophageal ultrasound was considered, however a CT was chosen due to its less invasive nature. A modified protocol was used to include both a prospective ECG-gated coronary artery study and a 10 second delayed phase.
During the arterial phase there was the impression of a filling defect within a mildly dilated left atrial appendage suspicious for a mass or thrombus. (Figure 1C) The critical phase in this series, the delayed 10 second phase, which showed the filling defect had disappeared suggesting the arterial phase anomaly, was caused by incomplete mixing of contrast. (Figure 1D)
Discussion:
This case highlights the importance of protocoling and making use of a delayed phase to differentiate a pseudo filling defect from true mass or thrombus. In this case the patient avoided further invasive investigation and treatment and any potential morbidity and complications they may bring. It has been shown that using a 2 phase acquisition significantly reduces pseudo filling defect detection when compared to single phase (2) and has a favourable sensitivity, specificity, positive and negative predictive values in detecting true thrombus when compared to the reference standard, trans-oesophageal echo. (3)
Question 2: What percentage of patients who have atrial fibrillation and a recent embolic event are shown to have LAA clot?
- 10%
- 15%
- 20%
- 30%
- 50%
Answer:
C) ≈20%. In a study of 317 patients with AF and a recent embolic event, 21-23% were found on transoesophageal echo to have left atrial appendage clot. (5)
30-40% of strokes have no demonstrable cause. The left atrium and specifically the left atrial appendage has been studied to shed light specifically on cryptogenic stroke. Specific LAA morphologies have been shown to increase the risk of LAA thrombus and stroke. LAA function has also been assessed and poorer function has been linked to LAA thrombus and stroke. (6)
Question 3: What are common causes of mass mimics on transthoracic echocardiography?
- Crista terminalis
- Right ventricular moderator band
- Atrioventricular groove fat
- Hiatal hernia
- All of the above
Answer:
E) The crista terminalis can appears as a hyperechoic structure against the right atrial wall. A thickened right ventricular moderator band can appear as a mass within the right ventricle. Lipomas of the atrioventricular groove can protrude into the atria or the ventricles and appear as an intracardiac mass. A hiatal hernia large enough can impress upon the heart and can cause a pseudomass within the left atrium. (7)
Figure 1: (A) TTE 4 chamber view demonstrating an echogenic structure within the left atrium possibly attaching to the atrial septum. (B)TTE 4 chamber view with colour flow contouring the echogenic structure within the left atrium. (C) Arterial phase CT showing a filling defect within the left atrial appendage (Arrow). (D) 10 second delay phase demonstrating resolution of the filling defect within the left atrial appendage.
References:
- Klatt EC, Heitz DR, et al. Cardiac metastases.Cancer1990; 65:1456-1459
- Pavitt, C& Lazoura, O, Lindsay A, et al. The Use of Cardiac CT for the Detection of Left Atrial Appendage Thrombus: A Quality Improvement Project. Heart 2014;100:A86-A87.
- Hur J, Kim YJ, Lee HJ, et al. Left Atrial Appendage Thrombi in Stroke Patients: Detection with Two-Phase Cardiac CT Angiography versus Transesophageal Echocardiography. Radiology 2009 251:3, 683-690.
- Burke A, Jeudy J, Virmani R. Cardiac tumours: an update. Heart 2008;94:117-123.
- Stoddard MF, Dawkins PR, Prince CR, Ammash NM. Left atrial appendage thrombus is not uncommon in patients with acute atrial fibrillation and a recent embolic event: a transoesophageal echocardiographic study. J Am Coll Cardiol 1995;25(2):452-9.
- Goldman ME, Pearce LA, Hart RG. Pathophysiologic correlates of thromboembolism in nonvalvular atrial fibrillation: reduced flow velocity in the left atrial appendage. J Am Soc Echocardiogr. 1999;12(12):1080-7.
- Malik, S. Chen, N. et al. Transthoracic echocardiography: Pitfalls and Limitations as Delineated at Cardiac CT and MR imaging. Radiographics 2017; 37:383-406


